Often it seems like the biggest part of machine learning is actually acquiring and cleaning up data. The state of Ohio provides crime data in CSV format however the data cannot be used out of the box. I’m sure it is useful for someone but not for running predictions or even BI tools in its current state. So, cleaning the data and formatting it into a way that is useable is a daunting task.
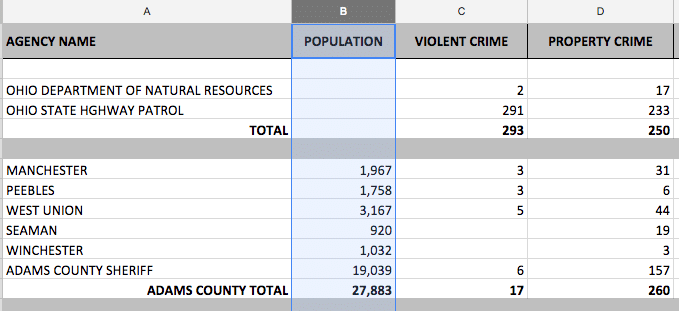
Below is an example of the original data (I clipped off the other crimes as that is not important to show the cleanup and changes required). First, the data is in separate files by year. You could run those files and pull all the data in and do a join but a full-scale cleanup is better for the long-run.
Initial data for 2016:

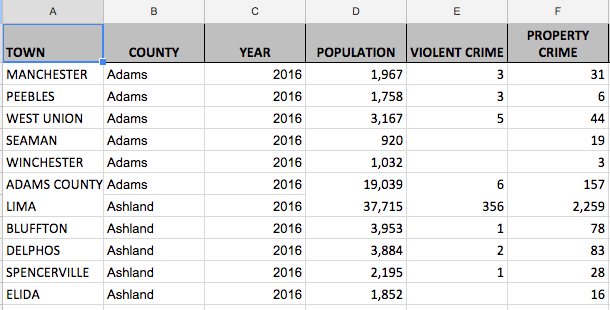
The cleaned up version removes empty lines, totals, and general housekeeping. The added columns are: town, year and county.

In the end the changes weren’t monumental but they were time consuming to do five years of data cleanup manually but worth the work. Next I’ll start showing some predictions based off the cleaned up data.


[…] In a previous post, I discuss cleaning public Ohio crime data. As I start to get deeper into the data, and go through years 2016-2009, many new issues come to light. It is also very good cleaning up because you also start to think of ideas as well. […]
[…] I started working on my Ohio Crime Data project, I started with inputting my data into a Google Sheet for the cleanup project. Once that was done, […]